
IDEATION
For this workshop, I chose my conversation history with Alexa as my small data set. As a graduate student living on a tight budget, I shared an old house with three roommates, which had no smart home devices installed. My primary interactions with Alexa were limited to playing music and setting alarms to wake me up in the morning. Despite living with the device for nearly a year, the data it contained was surprisingly sparse. This session gives me a good chance to reflect on my relationship with it - a companion spending endless days and nights with me.This workshop provided an opportunity to reflect on my relationship with Alexa, a companion that silently shared countless days and nights with me. The day before the workshop, I downloaded my interaction data from Amazon and formatted it into three columns: content, date, and time.
During the session, I started by reviewing the most recent conversations. To my surprise, I discovered several interesting, and at times, puzzling, exchanges that had slipped past my attention. As a non-native English speaker, I noticed how miscommunications occurred between Alexa and me. Alexa, being far less sophisticated than today’s advanced language models, added another layer of complexity. These misunderstandings and the relationship we built inspired me as I worked on this zine.
I categorized the conversations into three themes:
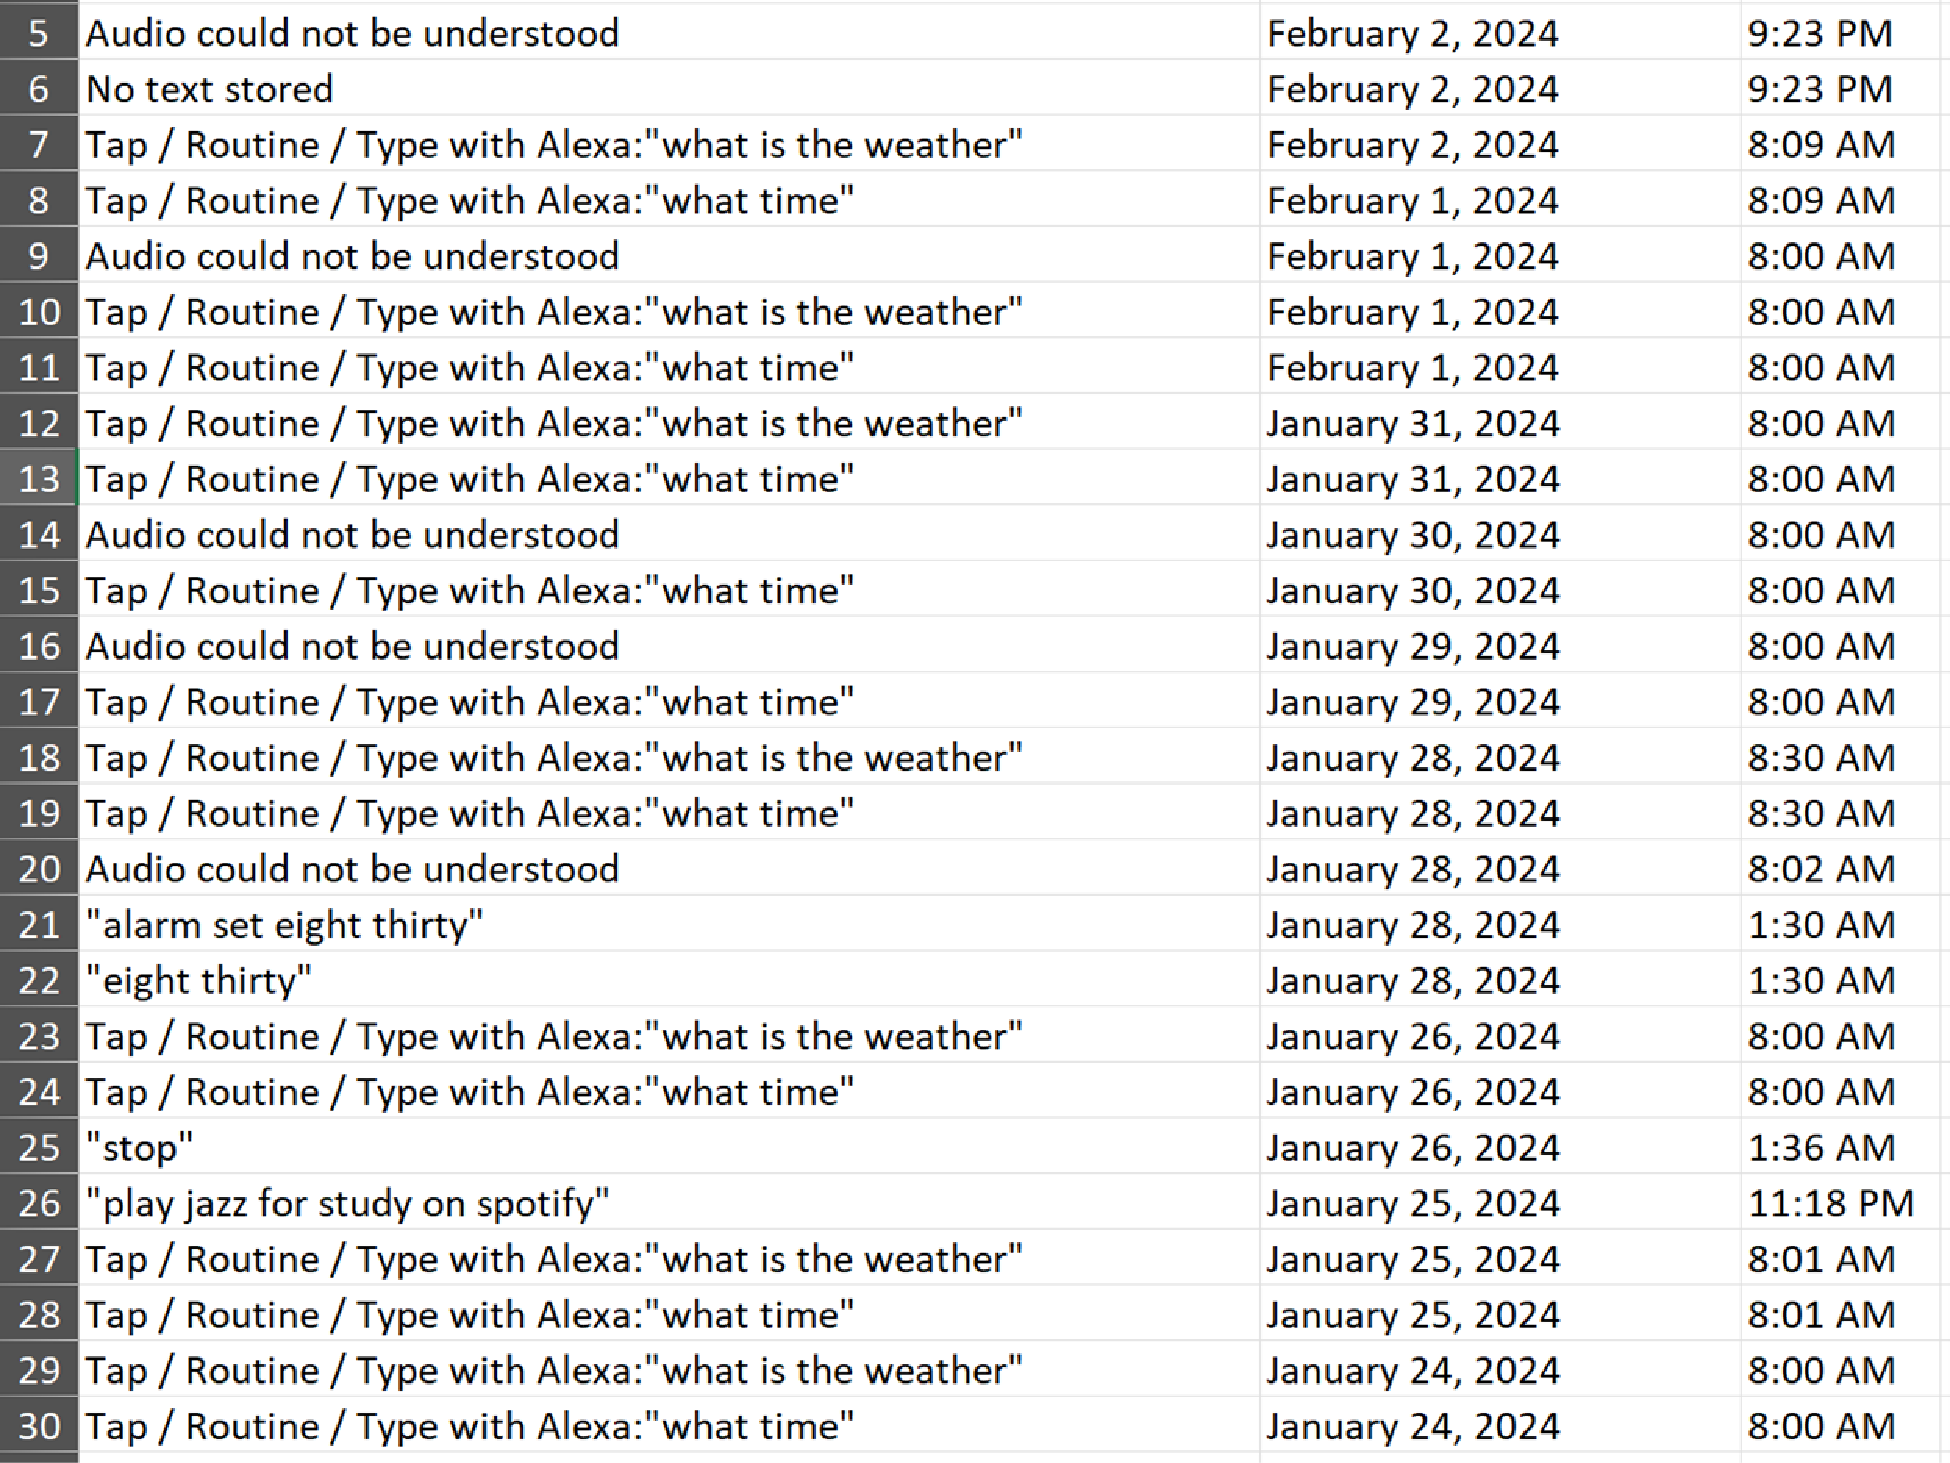
Type 1: Correct recognition: lucky me :)
Type 2: Alexa's fault: Due to limited speech recognition ability, Alexa can't read ambiguous commands beyond its skill set and learning algorithm. In this case, it can't parse the command and show:
"Audio could not be understood."
But what happens more frequently is that I can parse what I say but wrong.
Type 3: My fault: Voice recording only works when I press the recording button, but my English skills can't help me figure out what to say in such a short period, so it often captures nothing, which is shown as:
"No text stored."
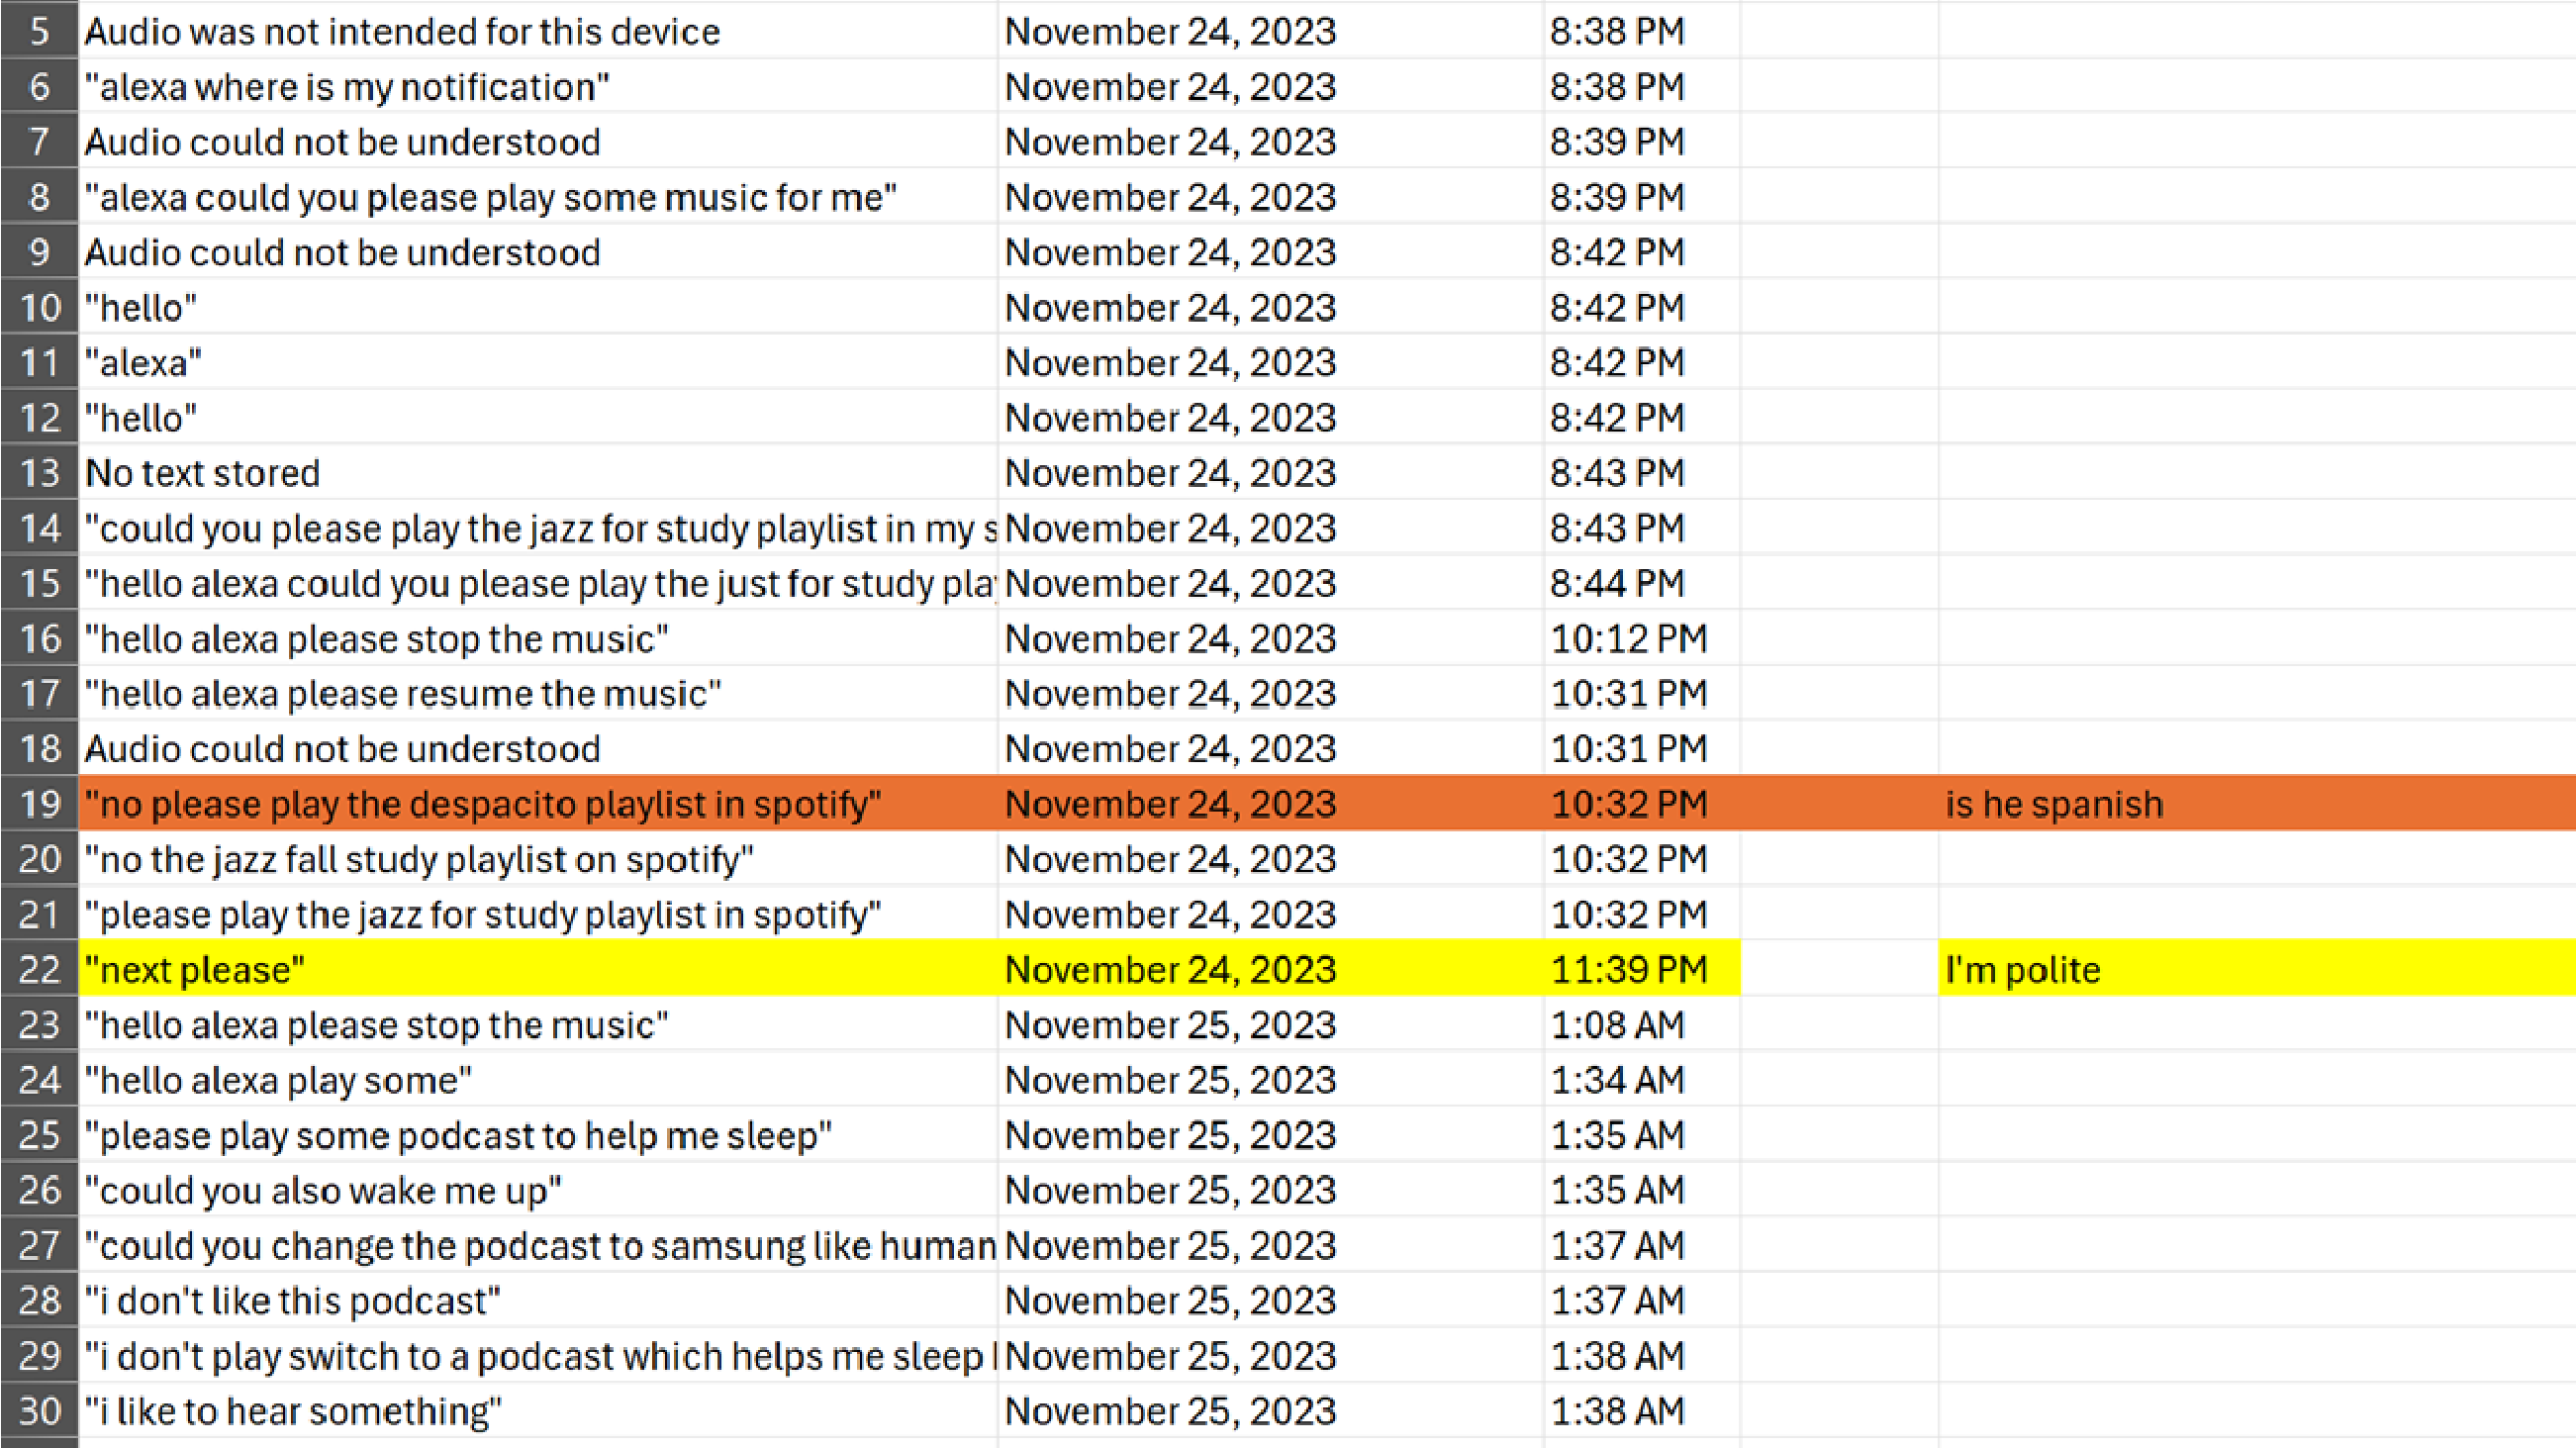
Sometimes, I would also overestimate its ability, so when I said something that it apparently can't recognize, this is what it thought:
"Audio was not intended for this device."
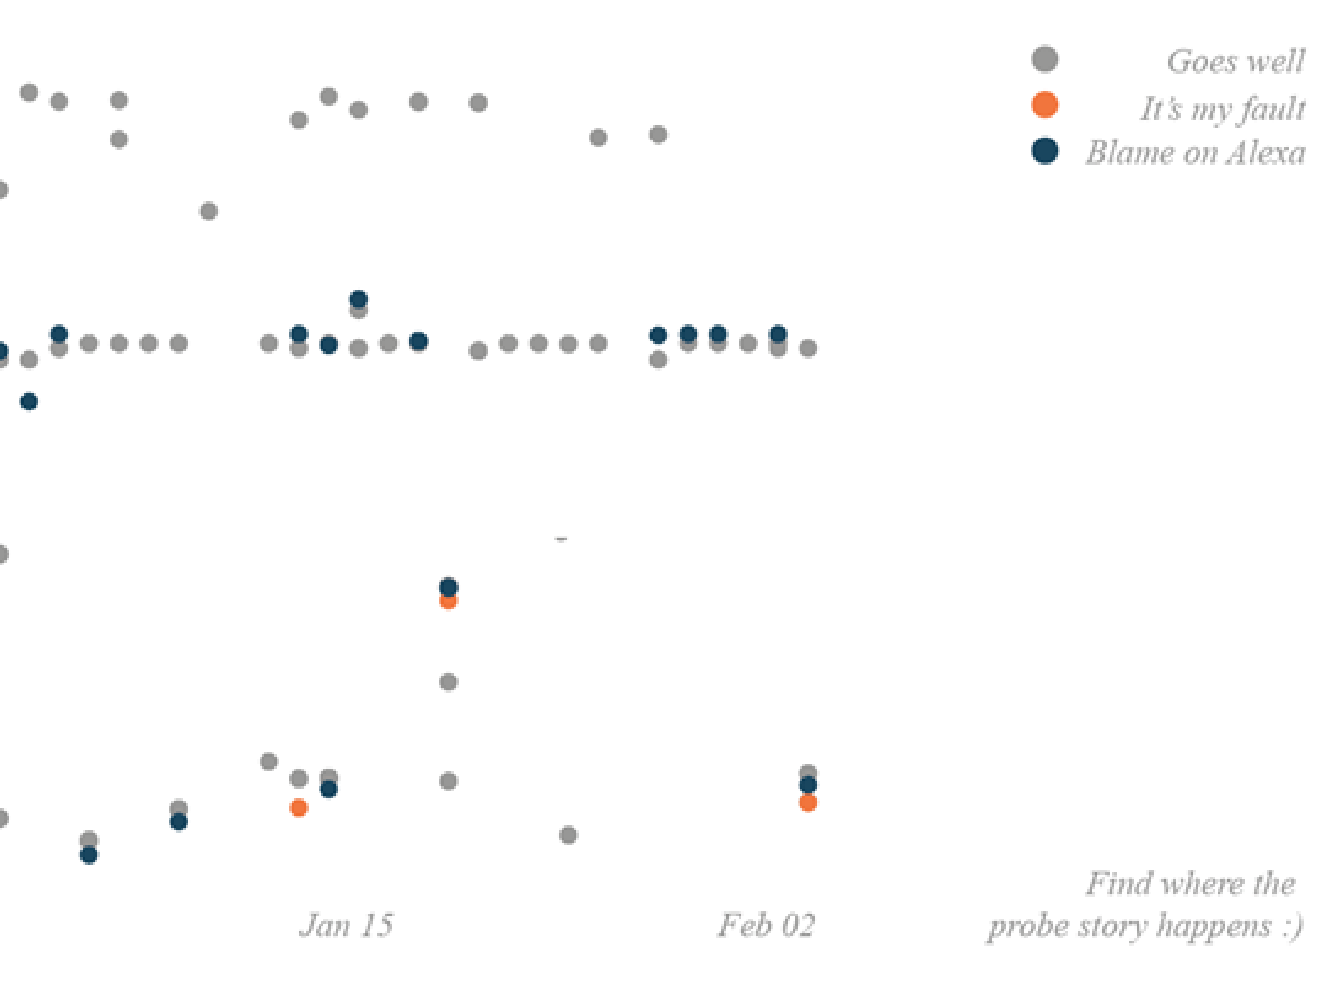
By examining the data within these categories, I naturally became curious about when these conversations occurred, how their frequency evolved over time, and how both Alexa's and my attitudes and impressions shifted after each interaction. This curiosity led me to focus on two key aspects for my data visualization:
- A timeline of conversations within each category.
- A trend map illustrating patterns across these categories.
However, diving into quantitative analysis too early felt restrictive to my creative process. Instead, I took a step back and imagined these trends in my mind, carefully reviewing the dataset and jotting down notes. Through this process, I found myself working as a detective: each conversation’s content and timestamp brought up vivid memories of what I was doing at that moment. These emerging stories felt so powerful and alive that I decided to represent this experience as an interaction within the zine itself.
Data inspection and annotation
PROGRESS
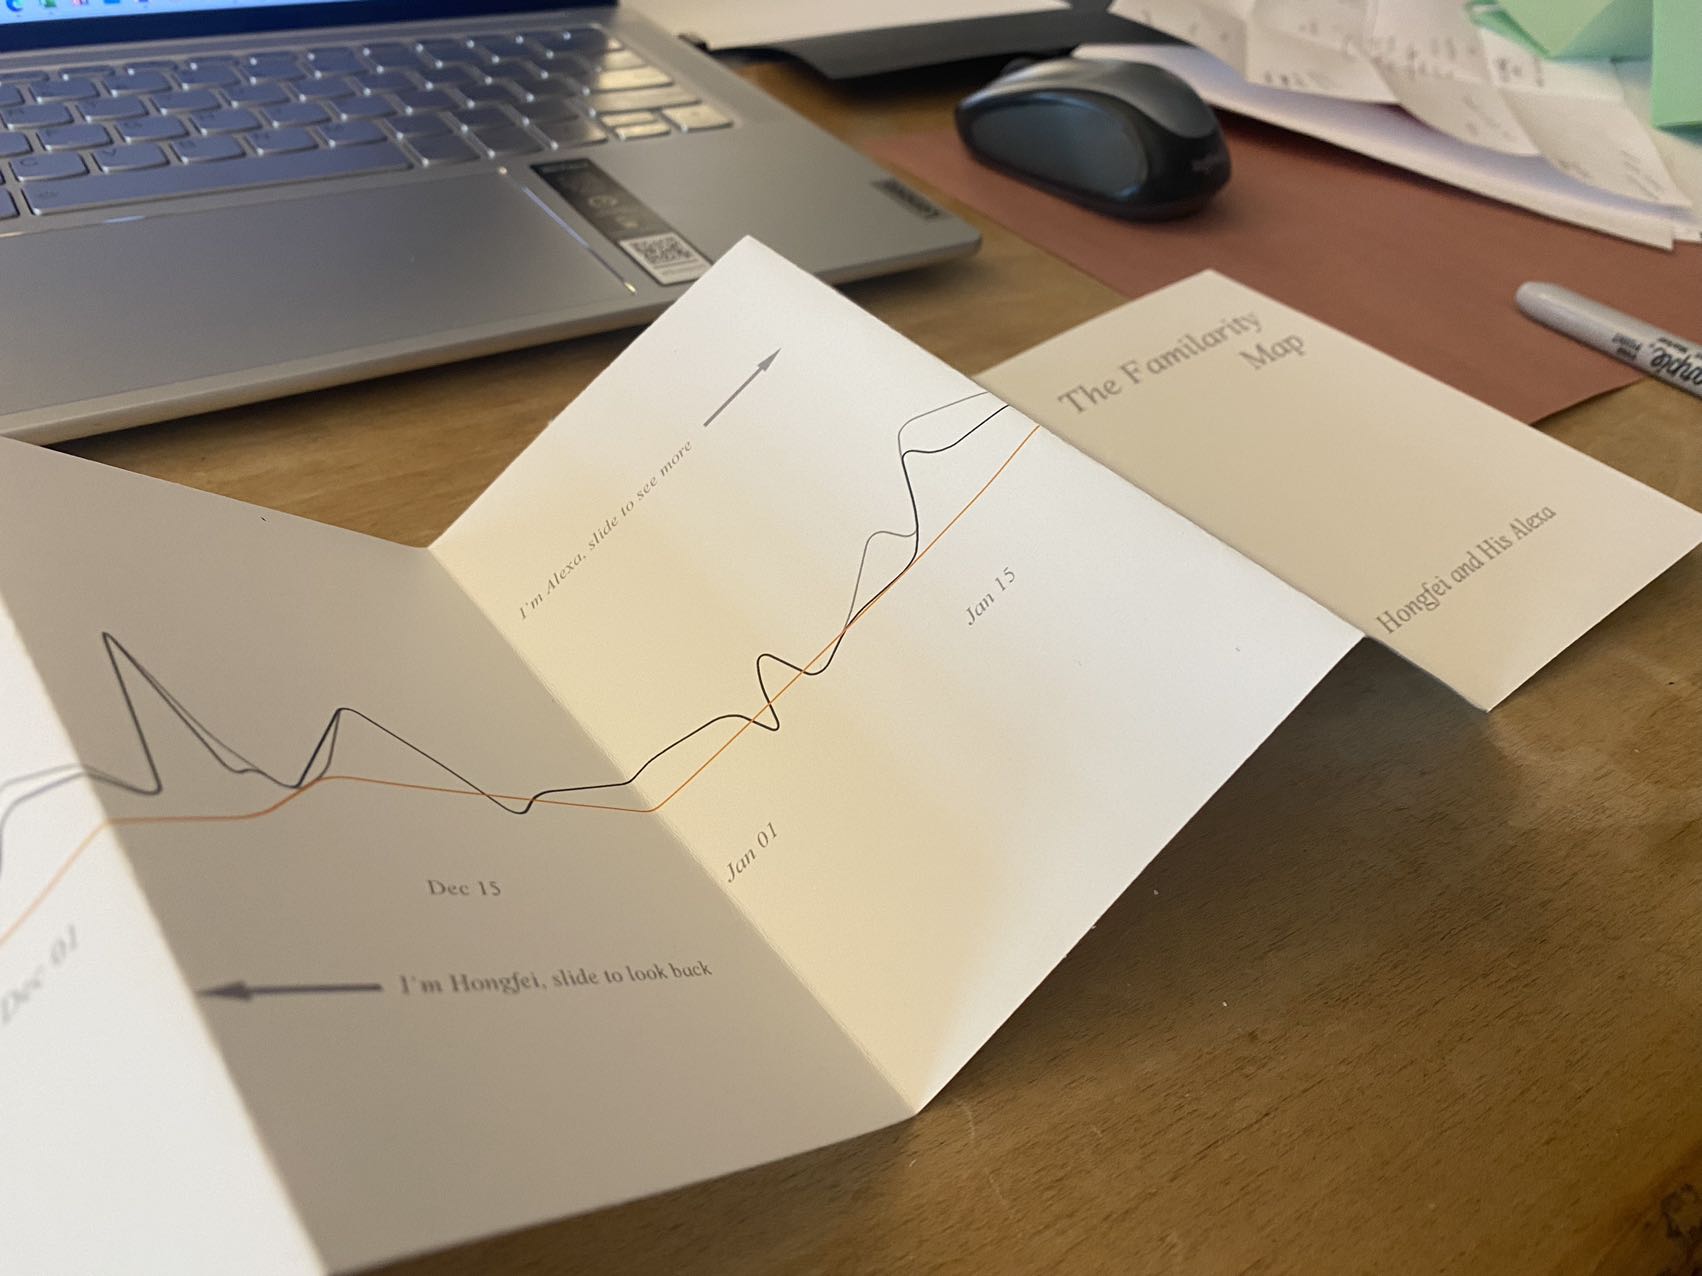
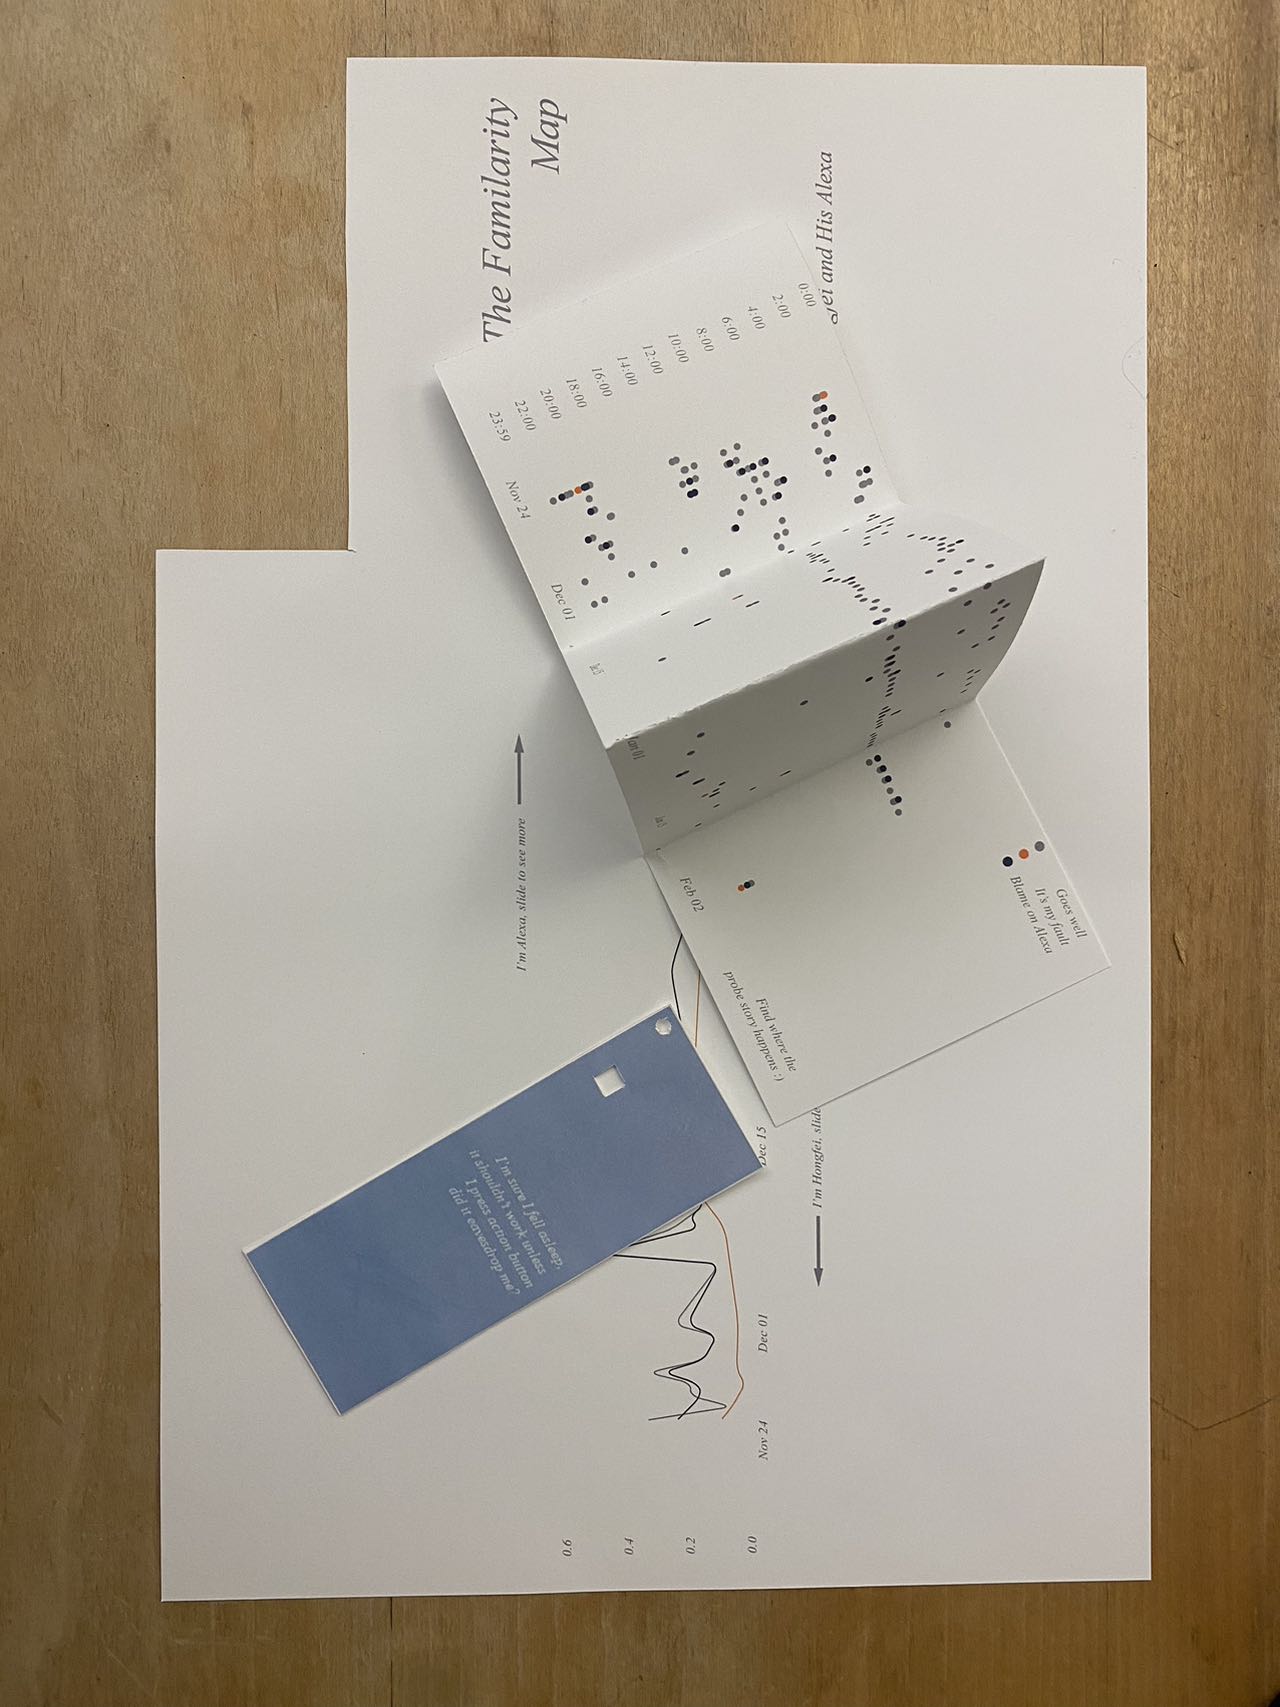
With a clear purpose in mind, I began prototyping. To best represent a timeline, I decided on a long diagram, which naturally lent itself to a physical form: a multi-folded map. A set of memory cards served as keys, guiding viewers to pinpoint when the stories on the cards occurred. For the comparison between myself and Alexa, I designed a two-direction slider—an intuitive medium for examining the relationship between two entities. This slider also works as a protective cover for the delicate map.With these goals in mind, the physical form took shape smoothly and naturally.
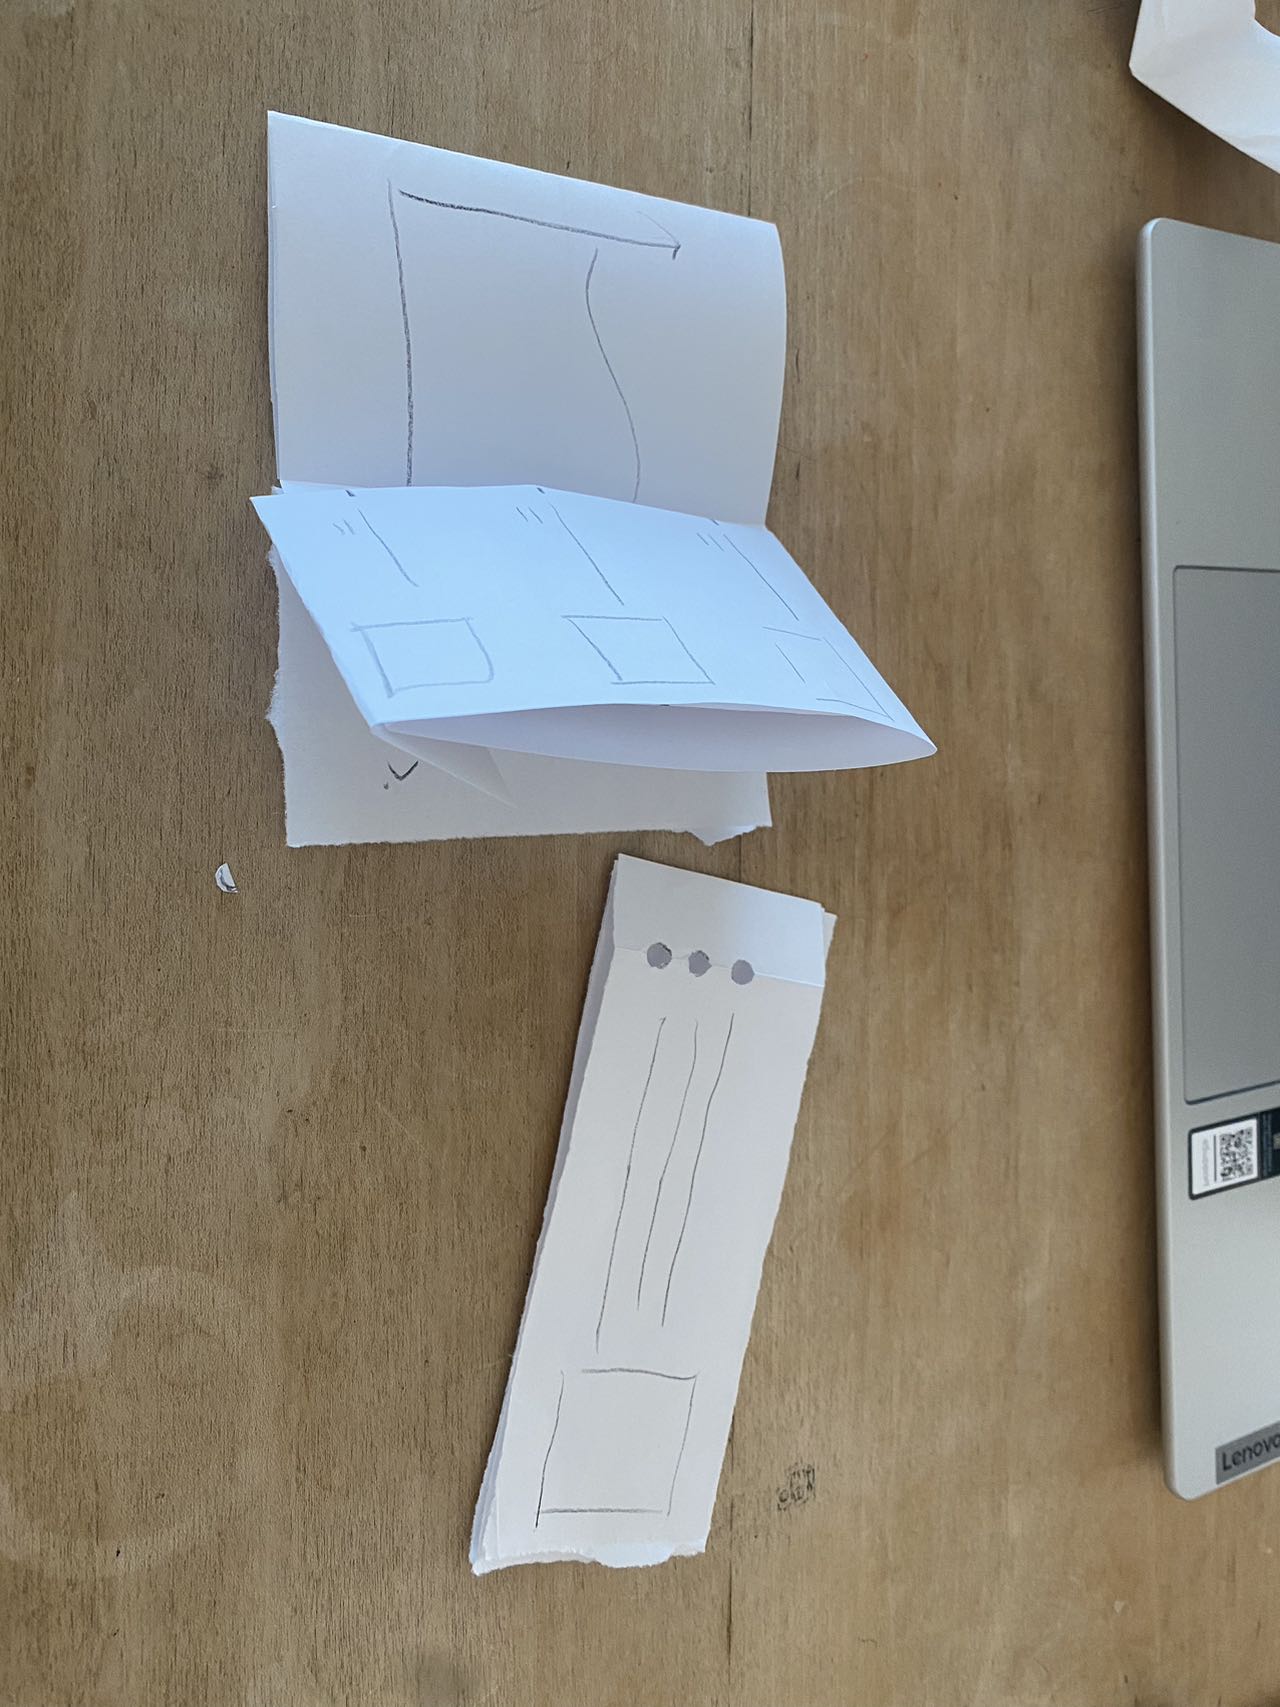

First Functional Prototype.
Next, I moved on to visualizing the data using Python. To enhance readability, I focused on refining the design of the legends, selecting thoughtful color schemes, and optimizing the overall layout.
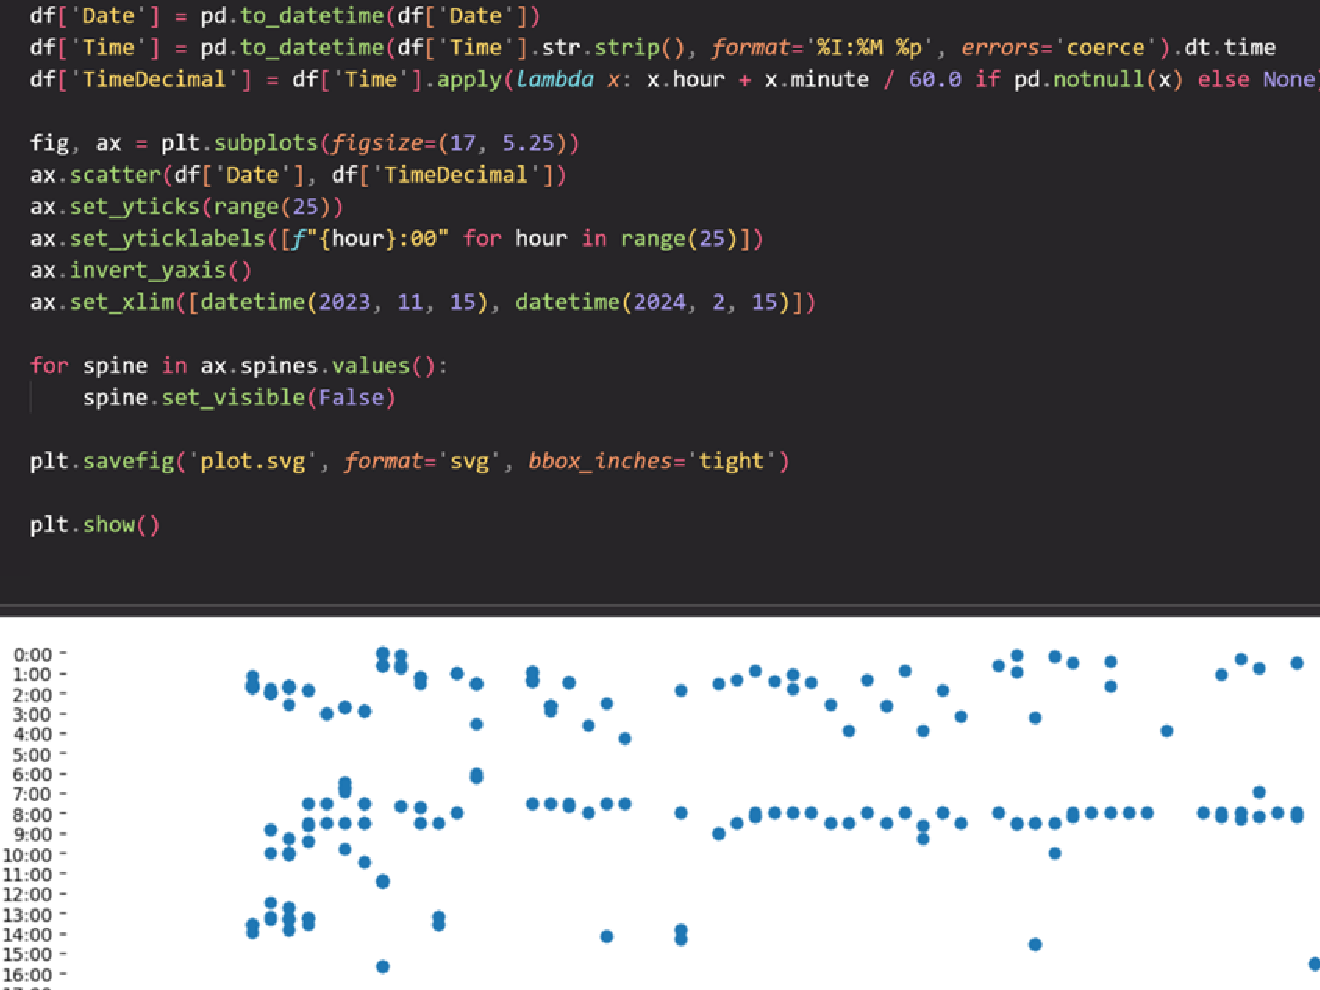
Data Visualization and Processing
Second Prototype: Test for Iteration
FINAL PRODUCT
The final product is a high-fidelity prototype of the zine described above. The colors represent the two entities: me and Alexa, and also subtly reflect the passage of time throughout the day (day and night). The cover is designed as a ruler, with key attitude shifts marked along. Readers are invited to explore these shifts by locating them on the map, creating an engaging, self-guided discovery experience.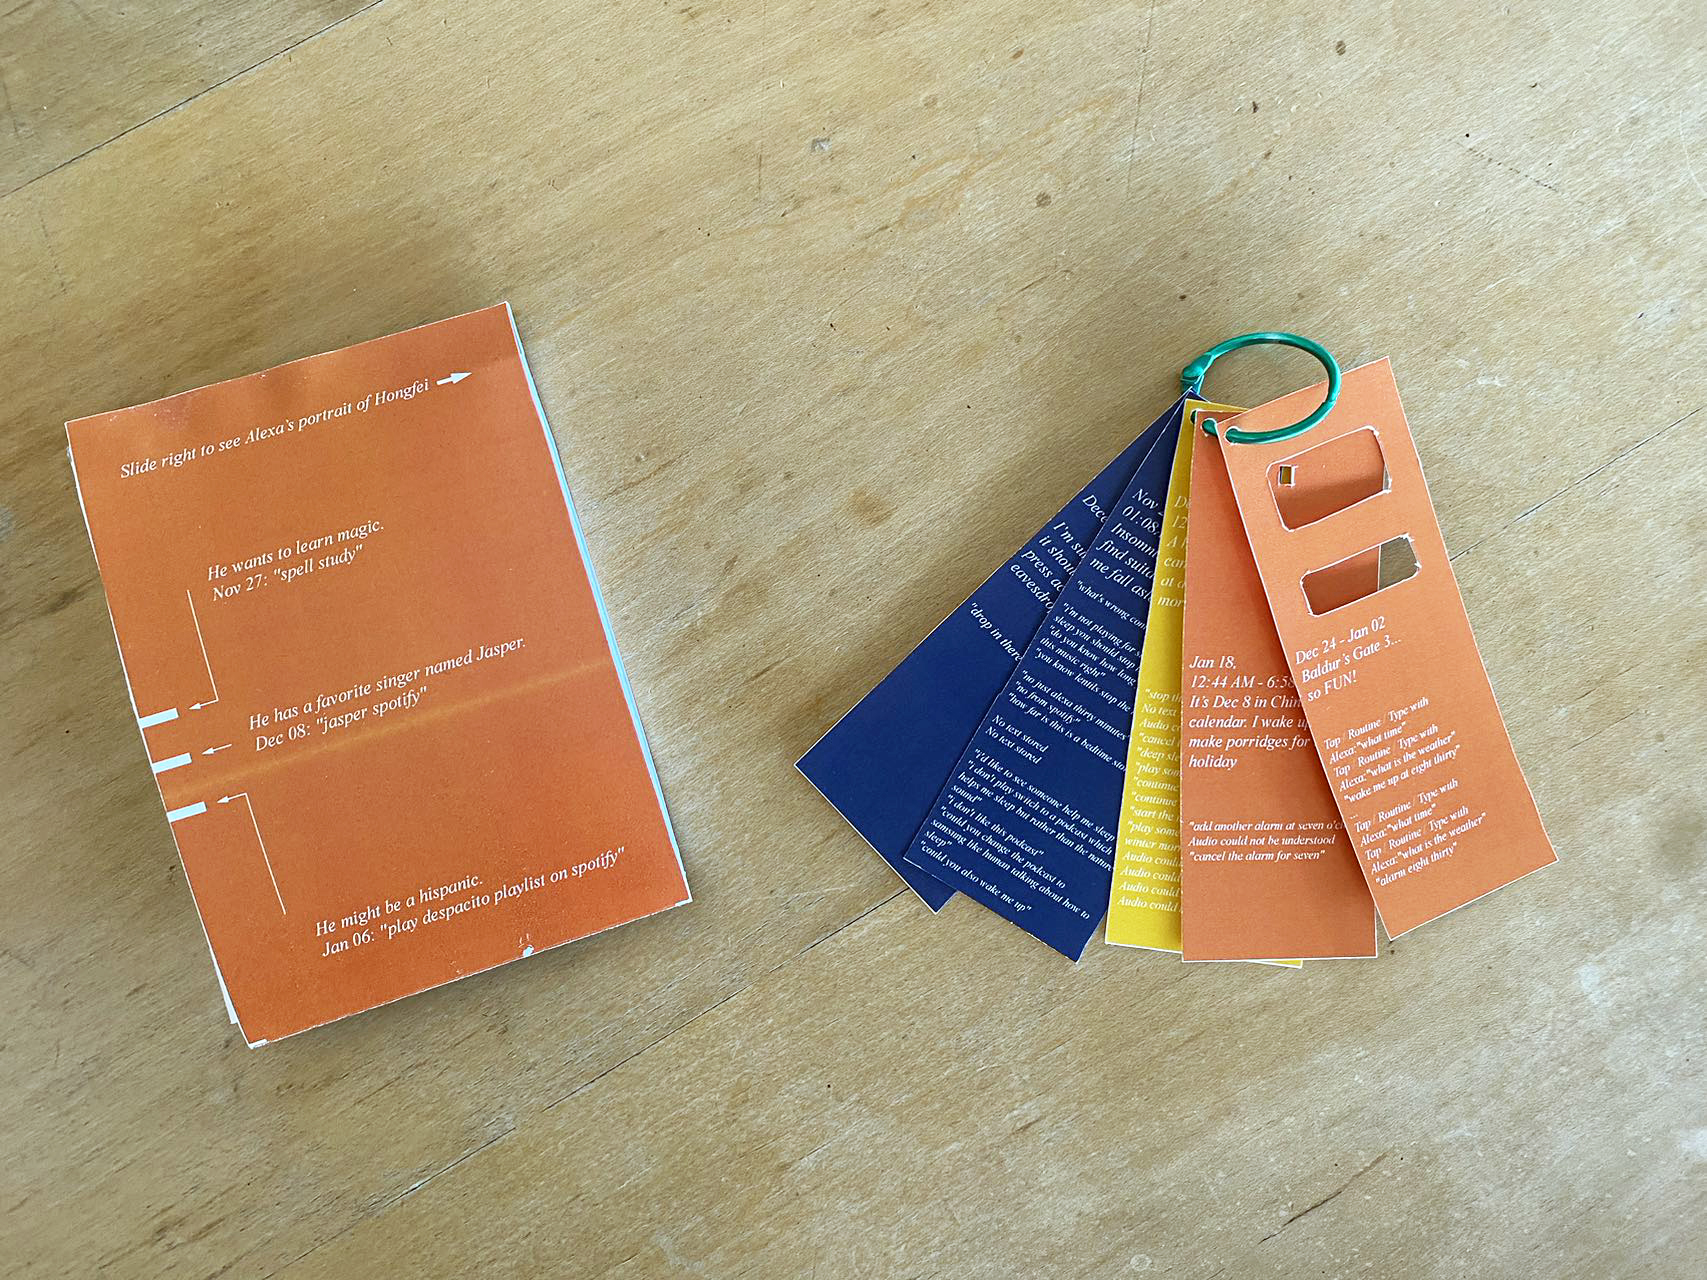
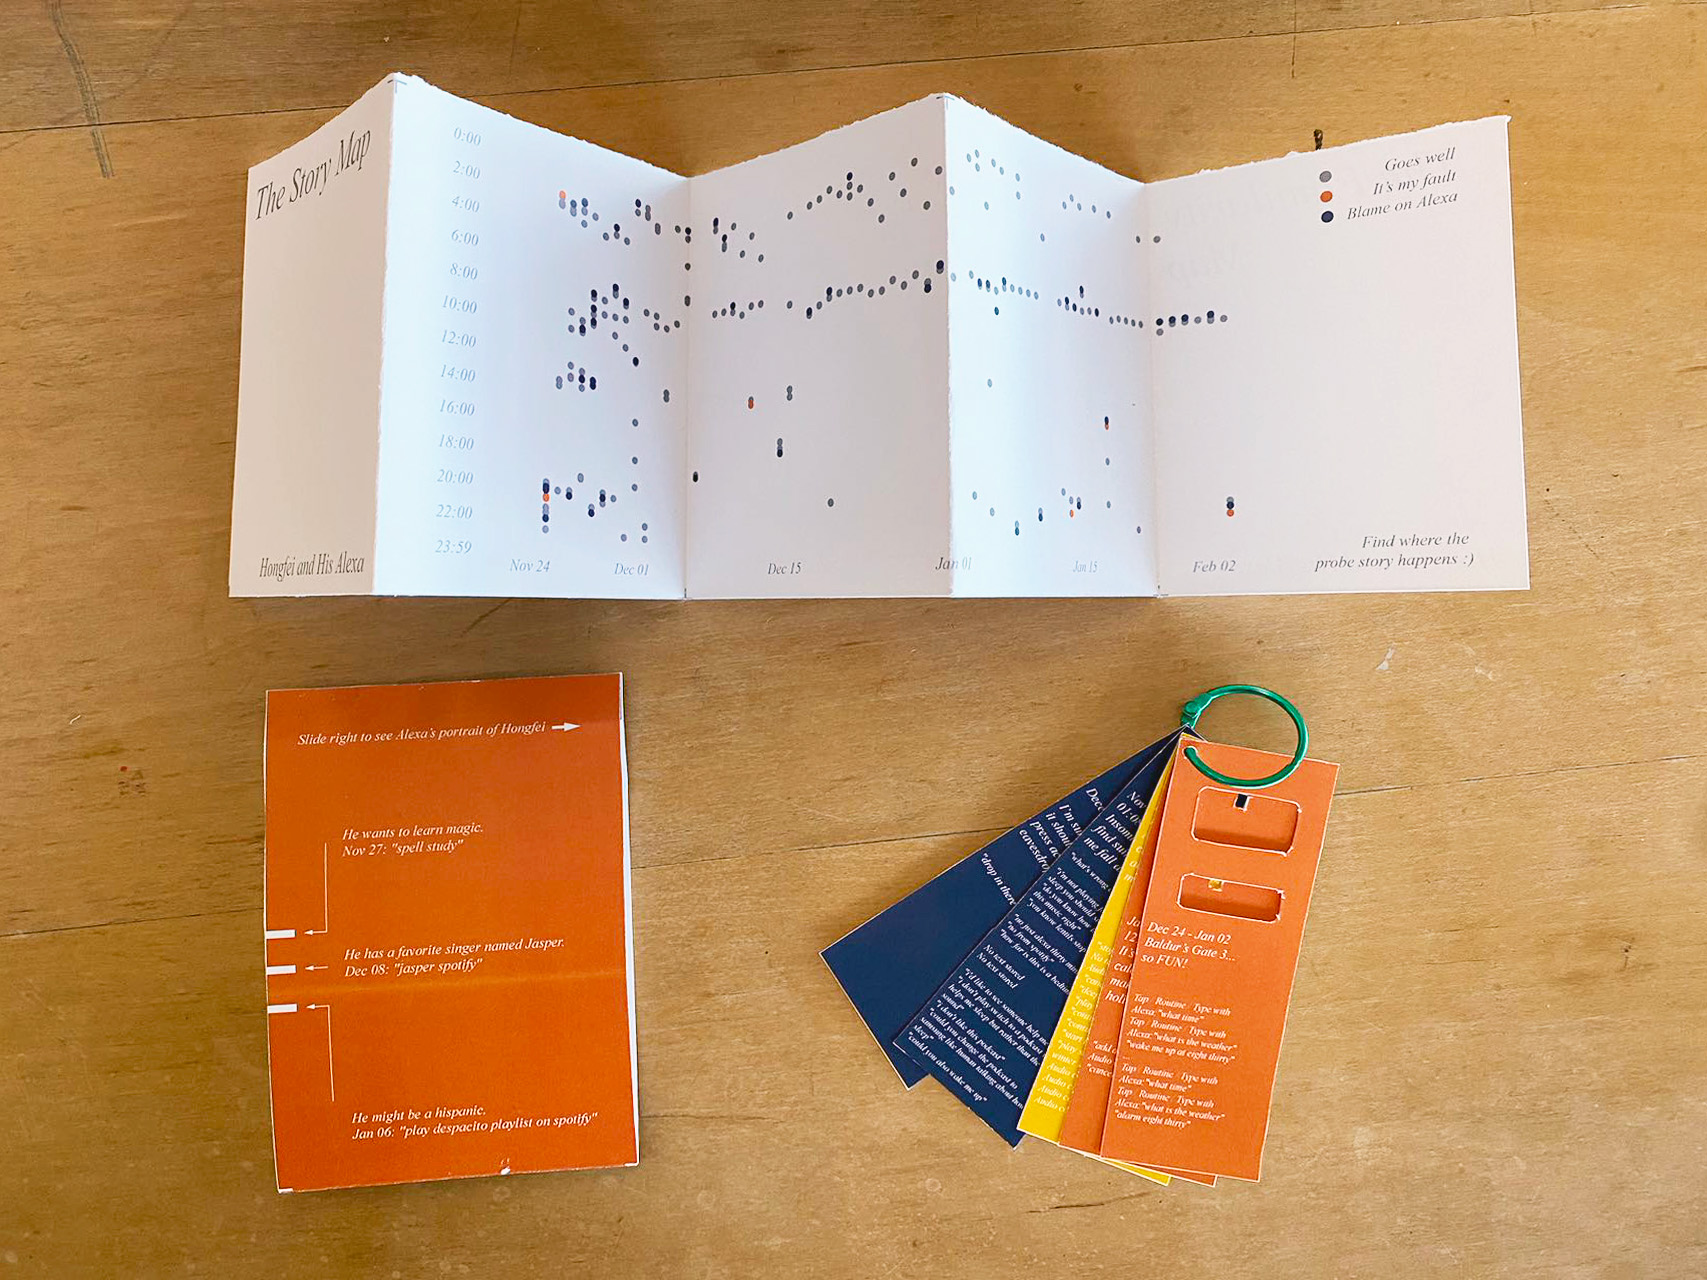
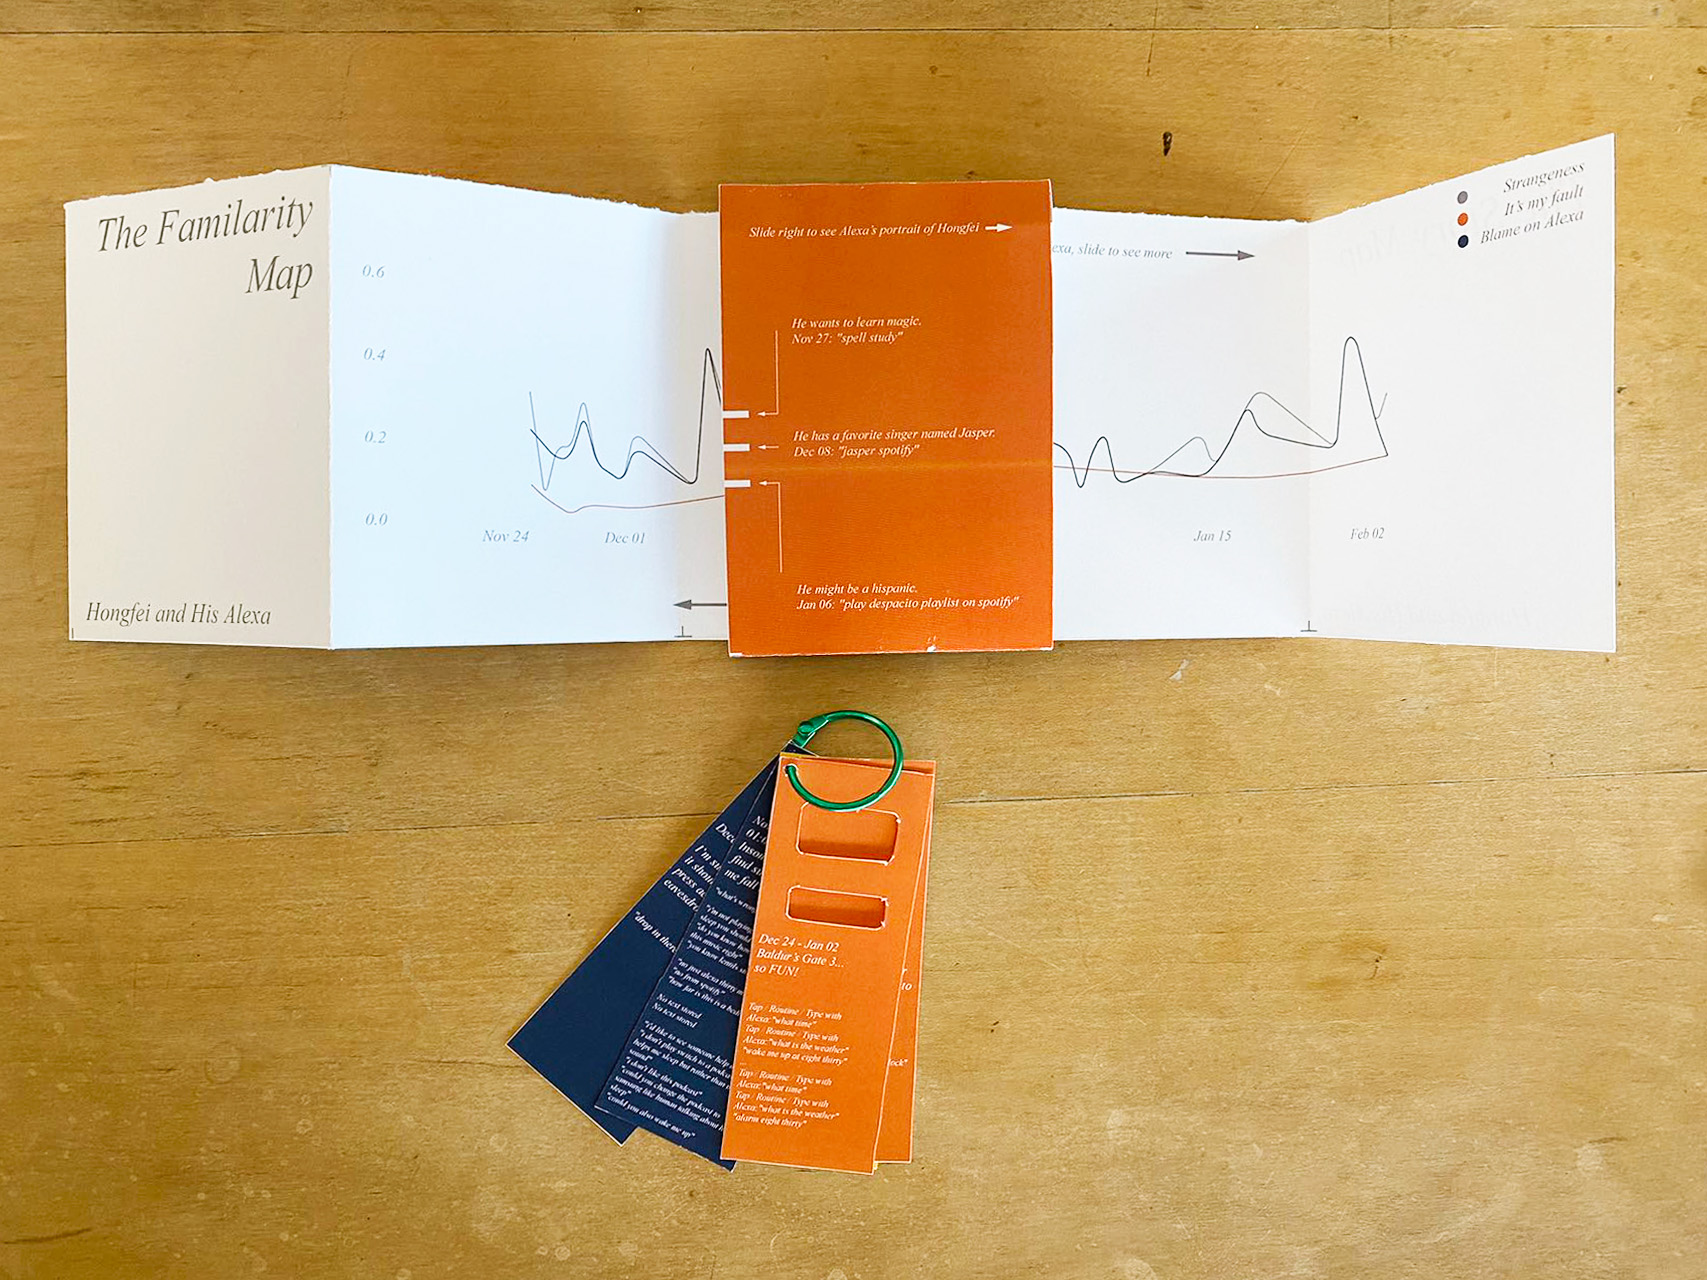
Final Product: Interactive Zine
REFLECTION
Due to time constraints, I didn’t have the opportunity to iterate further on the prototype, which is a bit disappointing. Additionally, I didn’t receive much feedback from the audience during the showcase. Reflecting on my work, I realized that trying to find a cohesive story in the chart might have been somewhat futile, as the chart itself didn’t provide any additional insights. Similarly, the trend map didn’t reveal the changes I had anticipated before visualizing the data.It seems that my relationship with Alexa hasn’t evolved in the way I had imagined. Alexa hasn’t grown better at understanding me, nor have I become more adept at interacting with it. Moreover, the dataset from Alexa doesn’t include its own feedback, so the conversation is ultimately one-sided: focused solely on my questions. Although I recalled some amusing responses from Alexa, I couldn’t represent them due to the lack of corresponding data.
Overall, the workshop was a valuable opportunity for me to reflect on my relationship with personal artifacts and to approach them with an interactive mindset. Despite the limitations, it allowed me to think critically about these interactions in a new and engaging way.